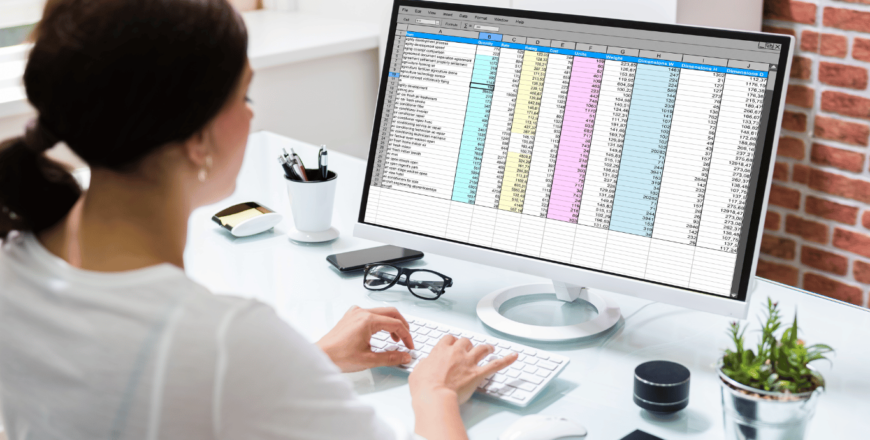
Excel for Beginners

Excel is a spreadsheet program i.e.; it contains rows and columns. It was created by Microsoft to work with data and make information easier to view for data analysts and other users. Excel is used to organize, calculate and format the data into meaningful categories.

Why should you learn this tool?

·       Excel is an essential tool when it comes to speeding up the workflow, increasing the productivity and be more efficient when working with large amounts of data and calculations.

·       Excel skills are highly regarded by the employers and learning excel will increase your value in the job market.

·       Excel is used in many finance-related fields and someone with good excel skills will benefit the company.

·       Non-traditional workers can also use Excel to their favor.

·       Working with Excel makes data more visible. This will help managers and senior staff members to have the information they need to make important decisions. 


Getting started with Excel Formulae

Data Entry : Editing & Formatting

Data formatting tool

Working with Cell & Range

Managing Worksheets

Excel Table

Excel Formulae

Data representation with Graph chart

Pivot Table

Excel is a spreadsheet software developed by Microsoft. It is widely used in business for tasks like data analysis, calculations, and creating visual representations of data.
The Excel interface consists of ribbons, columns, rows, and cells. You can navigate using arrow keys or by clicking on cells. Ribbons contain tabs for various functions like formatting, formulas, and data.
Cells are individual boxes where data is entered. Columns are vertical groups of cells labeled with letters (A, B, C, etc.), and rows are horizontal groups labeled with numbers (1, 2, 3, etc.).
Simply click on a cell and start typing. Press Enter to move to the cell below or use the arrow keys. You can also paste data from other sources.
Formulas are equations that perform calculations on data. Start a formula with an equal sign (=) and use functions like SUM or AVERAGE. Excel will calculate the result automatically.
Select the cells you want to format, right-click, and choose "Format Cells." You can change font, color, alignment, and more. Use the Home tab for additional formatting options.
Yes, Excel has a variety of chart types. Select your data, go to the Insert tab, and choose the chart type you want. You can customize charts further using the Chart Tools.
Conditional formatting allows you to highlight cells based on certain conditions. Select the cells, go to the Home tab, and choose "Conditional Formatting" to set rules for formatting.
Select your data range, go to the Data tab, and use the "Sort" and "Filter" options. Sorting arranges data in a specific order, while filtering displays only the data that meets certain criteria.
Yes, Excel supports collaboration. You can share files, work simultaneously with others using Excel Online, and track changes made by different users.
Enrolled: 17 students
Duration: 30 hours
Level: Beginner
ENROLL NOW

Working hours

Monday 9:30 am - 7.30 pm
Tuesday 9:30 am - 7.30 pm
Wednesday 9:30 am - 7.30 pm
Thursday 9:30 am - 7.30 pm
Friday 9:30 am - 7.30 pm
Saturday 10:00 am - 7.00 pm
Sunday 10:00 am - 7.00 pm